CLI Guide
Making open source more inclusive
Red Hat is committed to replacing problematic language in our code, documentation, and web properties. We are beginning with these four terms: master, slave, blacklist, and whitelist. Because of the enormity of this endeavor, these changes will be implemented gradually over several upcoming releases. For more details, see our CTO Chris Wright’s message.
1. Introduction
1.1. About the CLI Guide
This guide is for engineers, consultants, and others who want to use the Migration Toolkit for Applications (MTA) to migrate Java applications or other components. It describes how to install and run the CLI, review the generated reports, and take advantage of additional features.
1.2. About the Migration Toolkit for Applications
What is the Migration Toolkit for Applications?
Migration Toolkit for Applications (MTA) accelerates large-scale application modernization efforts across hybrid cloud environments on Red Hat OpenShift. This solution provides insight throughout the adoption process, at both the portfolio and application levels: inventory, assess, analyze, and manage applications for faster migration to OpenShift via the user interface.
MTA uses an extensive default questionnaire as the basis for assessing your applications, or you can create your own custom questionnaire, enabling you to estimate the difficulty, time, and other resources needed to prepare an application for containerization. You can use the results of an assessment as the basis for discussions between stakeholders to determine which applications are good candidates for containerization, which require significant work first, and which are not suitable for containerization.
MTA analyzes applications by applying one or more rulesets to each application considered to determine which specific lines of that application must be modified before it can be modernized.
MTA examines application artifacts, including project source directories and application archives, and then produces an HTML report highlighting areas needing changes.
How does the Migration Toolkit for Applications simplify migration?
The Migration Toolkit for Applications looks for common resources and known trouble spots when migrating applications. It provides a high-level view of the technologies used by the application.
MTA generates a detailed report evaluating a migration or modernization path. This report can help you to estimate the effort required for large-scale projects and to reduce the work involved.
1.2.1. Supported Migration Toolkit for Applications migration paths
The Migration Toolkit for Applications (MTA) supports the following migrations:
-
Migrating from third-party enterprise application servers, such as Oracle WebLogic Server, to JBoss Enterprise Application Platform (JBoss EAP).
-
Upgrading to the latest release of JBoss EAP.
MTA provides a comprehensive set of rules to assess the suitability of your applications for containerization and deployment on Red Hat OpenShift Container Platform (RHOCP). You can run an MTA analysis to assess your applications' suitability for migration to multiple target platforms.
| Source platform ⇒ | Migration to JBoss EAP 7 & 8 | OpenShift (cloud readiness) | OpenJDK 11, 17, and 21 | Jakarta EE 9 | Camel 3 & 4 | Spring Boot in Red Hat Runtimes | Quarkus | Open Liberty |
|---|---|---|---|---|---|---|---|---|
Oracle WebLogic Server |
✔ |
✔ |
✔ |
- |
- |
- |
- |
- |
IBM WebSphere Application Server |
✔ |
✔ |
✔ |
- |
- |
- |
- |
✔ |
JBoss EAP 4 |
✘ [1] |
✔ |
✔ |
- |
- |
- |
- |
- |
JBoss EAP 5 |
✔ |
✔ |
✔ |
- |
- |
- |
- |
- |
JBoss EAP 6 |
✔ |
✔ |
✔ |
- |
- |
- |
- |
- |
JBoss EAP 7 |
✔ |
✔ |
✔ |
- |
- |
- |
✔ |
- |
Thorntail |
✔ [2] |
- |
- |
- |
- |
- |
- |
- |
Oracle JDK |
- |
✔ |
✔ |
- |
- |
- |
- |
- |
Camel 2 |
- |
✔ |
✔ |
- |
✔ |
- |
- |
- |
Spring Boot |
- |
✔ |
✔ |
✔ |
- |
✔ |
✔ |
- |
Any Java application |
- |
✔ |
✔ |
- |
- |
- |
- |
- |
Any Java EE application |
- |
- |
- |
✔ |
- |
- |
- |
- |
For more information about use cases and migration paths, see the MTA for developers web page.
1.3. The MTA CLI
The CLI is a command-line tool in the Migration Toolkit for Applications that you can use to assess and prioritize migration and modernization efforts for applications. It provides numerous reports that highlight the analysis without using the other tools. The CLI includes a wide array of customization options. By using the CLI, you can tune MTA analysis options or integrate with external automation tools.
2. Installing and Running the CLI
2.1. Installing the CLI
You can install the CLI on Linux, Windows, or macOS operating systems.
-
Red Hat Container Registry Authentication for
registry.redhat.io. Red Hat distributes container images from registry.redhat.io, which requires authentication. For more details, see Red Hat Container Registry Authentication. -
Podman must be installed
NotePodmanPodman is a daemonless, open source, Linux-native tool designed to make it easy to find, run, build, share, and deploy applications using Open Containers Initiative (OCI) Containers and Container Images. Podman provides a command-line interface (CLI) familiar to anyone who has used the Docker Container Engine. For more information on installing and using Podman, see Podman installation instructions.
2.1.1. Installing the CLI .zip file
To install using the downloadable .zip file:
-
Navigate to the MTA Download page and download the OS-specific CLI file or the
srcfile:-
mta-7.0.3-cli-linux.zip
-
mta-7.0.3-cli-macos.zip
-
mta-7.0.3-cli-windows.zip
-
mta-7.0.3-cli-src.zip
-
-
Extract the
.zipfile to a directory of your choice. The.zipfile extracts a single binary, called mta-cli.When you encounter
<MTA_HOME>in this guide, replace it with the actual path to your MTA installation.
2.1.2. Installing the CLI using Podman
-
Red Hat Container Registry Authentication for
registry.redhat.io. Red Hat distributes container images from registry.redhat.io, which requires authentication. For more details, see Red Hat Container Registry Authentication.
To install using podman pull:
-
To use Podman to authenticate to registry.redhat.io:
podman login registry.redhat.io Username: <username> Password: <***********> -
Issue:
podman cp $(podman create registry.redhat.com/mta-toolkit/mta-mta-cli-rhel9:{ProductVersion}):/usr/local/bin/mta-cli ./This command will copy the binary
PATHfor system-wide use.WarningAlthough installation using Podman is possible, downloading and installing the
.zipfile is the preferred installation.
2.1.3. CLI known issues
The CLI is built and distributed with support for Microsoft Windows.
However, when running any container image based on Red Hat Enterprise Linux 9 (RHEL9) or Universal Base Image 9 (UBI9), the following error can be returned when starting the container:
Fatal glibc error: CPU does not support x86-64-v2This error is caused because Red Hat Enterprise Linux 9 or Universal Base Image 9 container images must be run on a CPU architecture that supports x86-64-v2.
For more details, see (Running Red Hat Enterprise Linux 9 (RHEL) or Universal Base Image (UBI) 9 container images fail with "Fatal glibc error: CPU does not support x86-64-v2").
CLI runs the container runtime correctly. However, different container runtime configurations are not supported.
Although unsupported, you can run CLI with Docker instead of Podman, which would resolve this issue.
To achieve this, you replace the PODMAN_BIN path with the path to Docker.
For example, if you experience this issue, instead of issuing:
PODMAN_BIN=/usr/local/bin/docker mta-cli analyzeYou replace PODMAN_BIN with the path to Docker:
<Docker Root Dir>=/usr/local/bin/docker mta-cli analyzeWhile this is not supported, it would allow you to explore CLI while you work to upgrade your hardware or move to hardware that supports x86_64-v2.
2.2. Running the CLI
You can run MTA against your application.
-
Open a terminal and navigate to the
<MTA_HOME>/directory. -
Execute the
mta-cliscript, ormta-cli.exefor Windows, and specify the appropriate arguments:$ ./mta-cli analyze --input /path/to/jee-example-app-1.0.0.ear \ --output /path/to/output --source weblogic --target eap6 \-
--input: The application to be evaluated. -
--output: The output directory for the generated reports. -
--source: The source technology for the application migration.
-
-
Access the report.
2.2.1. MTA command examples
Running MTA on an application archive
The following command analyzes the jee-example-app-1.0.0.ear example EAR archive for migrating from JBoss EAP 5 to JBoss EAP 7:
$ <MTA_HOME>/mta-cli analyze \
    --input /path/to/jee-example-app-1.0.0.ear \
    --output /path/to/report-output/ --source eap5 --target eap7 \
Running MTA on source code
The following command analyzes the seam-booking-5.2 example source code for migrating to JBoss EAP 6.
$ <MTA_HOME>/mta-cli analyze --mode source-only --input /path/to/seam-booking-5.2/ \
    --output /path/to/report-output/ --target eap6 --packages org.jboss.seam
Running cloud-readiness rules
The following command analyzes the jee-example-app-1.0.0.ear example EAR archive for migrating to JBoss EAP 7. It also evaluates for cloud readiness:
$ <MTA_HOME>/mta-cli analyze --input /path/to/jee-example-app-1.0.0.ear \
    --output /path/to/report-output/ \
    --target eap7
2.2.2. Performing analysis using the command line
Analyze allows running source code and binary analysis using analyzer-lsp.
mta-cli analyze --input=<path/to/source/code> --output=<path/to/output/dir>All flags:
Analyze application source code

Usage:
  mta-cli analyze [flags]

Flags:
      --analyze-known-libraries   analyze known open-source libraries
  -h, --help                      help for analyze
  -i, --input string              path to application source code or a binary
      --json-output               create analysis and dependency output as json
      --list-sources              list rules for available migration sources
      --list-targets              list rules for available migration targets
  -l, --label-selector string     run rules based on specified label selector expression
      --maven-settings string     path to a custom maven settings file to use
      --overwrite                 overwrite output directory
      --skip-static-report        do not generate the static report
  -m, --mode string               analysis mode. Must be one of 'full' or 'source-only' (default "full")
  -o, --output string             path to the directory for analysis output
      --rules stringArray         filename or directory containing rule files
      --skip-static-report        do not generate the static report
  -s, --source string             source technology to consider for analysis. To specify multiple sources, repeat the parameter: --source <source_1> --source <source_2> etc.
  -t, --target string             target technology to consider for analysis. To specify multiple targets, repeat the parameter: --target <target_1> --target <target_2> etc.

Global Flags:
      --log-level uint32   log level (default 4)
--no-cleanup do not cleanup temporary resources-
Get an example application to run analysis on.
-
List available target technologies.
mta-cli analyze --list-targets -
Run an analysis with a specified target technology, for example
cloud-readiness.mta-cli analyze --input=<path-to/example-applications/example-1> --output=<path-to-output-dir> --target=cloud-readiness -
Several analysis reports are created in your specified output path:
$ ls ./output/ -1
analysis.log
dependencies.yaml
dependency.log
output.yaml
static-report
output.yaml is the file that contains the issues report.
static-report contains the static HTML report.
dependencies.yaml contains a dependencies report.
2.2.3. Performing transformation using the command line
Transform has two sub commands - openrewrite and rules.
Transform application source code or mta XML rules

Usage:
  mta-cli transform [flags]
  mta-cli transform [command]

Available Commands:
  openrewrite Transform application source code using OpenRewrite recipes
  rules       Convert XML rules to YAML

Flags:
  -h, --help   help for transform

Global Flags:
      --log-level uint32   log level (default 4)
      --no-cleanup         do not cleanup temporary resources

Use "mta-cli transform [command] --help" for more information about a command.
OpenRewrite
The openrewrite sub command allows running OpenRewrite recipes on source code.
Transform application source code using OpenRewrite recipes

Usage:
  mta-cli transform openrewrite [flags]

Flags:
  -g, --goal string     target goal (default "dryRun")
  -h, --help            help for openrewrite
  -i, --input string    path to application source code directory
  -l, --list-targets    list all available OpenRewrite recipes
  -s, --maven-settings string   path to a custom maven settings file to use
  -t, --target string   target openrewrite recipe to use. Run --list-targets to get a list of packaged recipes.

Global Flags:
      --log-level uint32   log level (default 4)
--no-cleanup do not cleanup temporary resourcestransform openrewrite on application source code, run the following command:mta-cli transform openrewrite --input=<path/to/source/code> --target=<exactly_one_target_from_the_list>|
Note
|
You can only use a single target to run the |
Rules
The rules sub command allows converting mta XML rules to analyzer-lsp YAML rules using windup-shim.
Convert XML rules to YAML

Usage:
  mta-cli transform rules [flags]

Flags:
  -h, --help                help for rules
  -i, --input stringArray   path to XML rule file(s) or directory
  -o, --output string       path to output directory

Global Flags:
--log-level int log level (default 5)transform rules on application source code, run the following:mta-cli transform rules --input=<path/to/xmlrules> --output=<path/to/output/dir>-
Get an example application to transform source code.
-
View the available OpenRewrite recipes.
mta-cli transform openrewrite --list-targets -
Run a recipe on the example application.
mta-cli transform openrewrite --input=<path-to/jakartaee-duke> --target=jakarta-importsInspect the
jakartaee-dukeapplication source code diff to see the transformation
Available OpenRewrite recipes
| Migration path | Purpose | rewrite.configLocation | activeRecipes |
|---|---|---|---|
Java EE to Jakarta EE |
Replace import of Replace |
|
|
Java EE to Jakarta EE |
Rename bootstrapping files |
|
|
Java EE to Jakarta EE |
Transform |
|
|
Spring Boot to Quarkus |
Replace |
|
|
2.3. Accessing reports
When you run the Migration Toolkit for Applications, a report is generated in the <OUTPUT_REPORT_DIRECTORY> that you specify using the --output argument in the command line.
The output directory contains the following files and subdirectories:
<OUTPUT_REPORT_DIRECTORY>/
├── index.html          // Landing page for the report
├── <EXPORT_FILE>.csv   // Optional export of data in CSV format
├── archives/           // Archives extracted from the application
├── mavenized/          // Optional Maven project structure
├── reports/            // Generated HTML reports
├── stats/              // Performance statistics
-
Obtain the path of the
index.htmlfile of your report from the output that appears after you run MTA:Report created: <OUTPUT_REPORT_DIRECTORY>/index.html Access it at this URL: file:///<OUTPUT_REPORT_DIRECTORY>/index.html -
Open the
index.htmlfile by using a browser.The generated report is displayed.
3. Reviewing the reports
The report examples shown in the following sections are a result of analyzing the com.acme and org.apache packages in the jee-example-app-1.0.0.ear example application, which is located in the MTA GitHub source repository.
The report was generated using the following command.
$ <MTA_HOME>/bin/mta-cli --input /home/username/mta-cli-source/test-files/jee-example-app-1.0.0.ear/ --output /home/username/mta-cli-reports/jee-example-app-1.0.0.ear-report --target eap6 --packages com.acme org.apache
Use a browser to open the index.html file located in the report output directory. This opens a landing page that lists the applications that were processed. Each row contains a high-level overview of the story points, number of incidents, and technologies encountered in that application.

|
Note
|
The incidents and estimated story points change as new rules are added to MTA. The values here may not match what you see when you test this application. |
The following table lists all of the reports and pages that can be accessed from this main MTA landing page. Click the name of the application, jee-example-app-1.0.0.ear, to view the application report.
| Page | How to Access |
|---|---|
Application |
Click the name of the application. |
Technologies report |
Click the Technologies link at the top of the page. |
Archives shared by multiple applications |
Click the Archives shared by multiple applications link. Note that this link is only available when there are shared archives across multiple applications. |
Rule providers execution overview |
Click the Rule providers execution overview link at the bottom of the page. |
Note that if an application shares archives with other analyzed applications, you will see a breakdown of how many story points are from shared archives and how many are unique to this application.
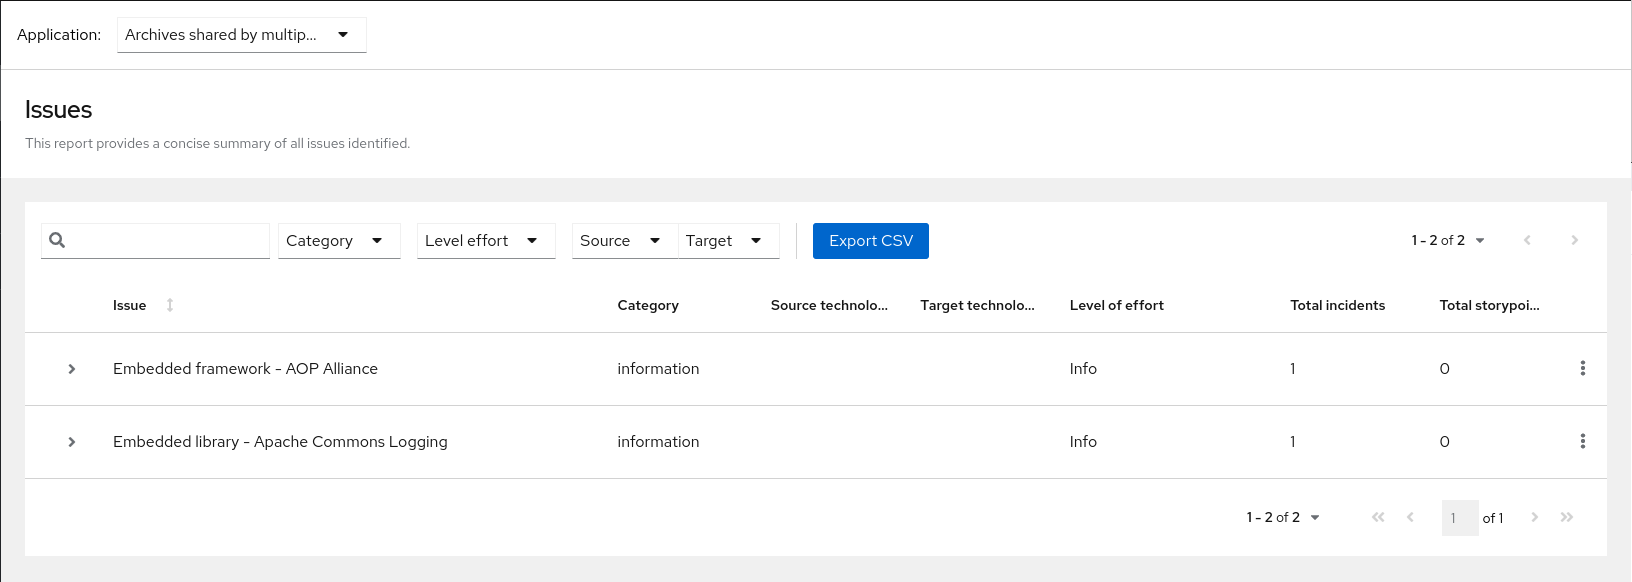
Information about the archives that are shared among applications can be found in the Archives Shared by Multiple Applications reports.
3.1. Application report
3.1.1. Dashboard
Access this report from the report landing page by clicking on the application name in the Application List.
The dashboard gives an overview of the entire application migration effort. It summarizes:
-
The incidents and story points by category
-
The incidents and story points by level of effort of the suggested changes
-
The incidents by package
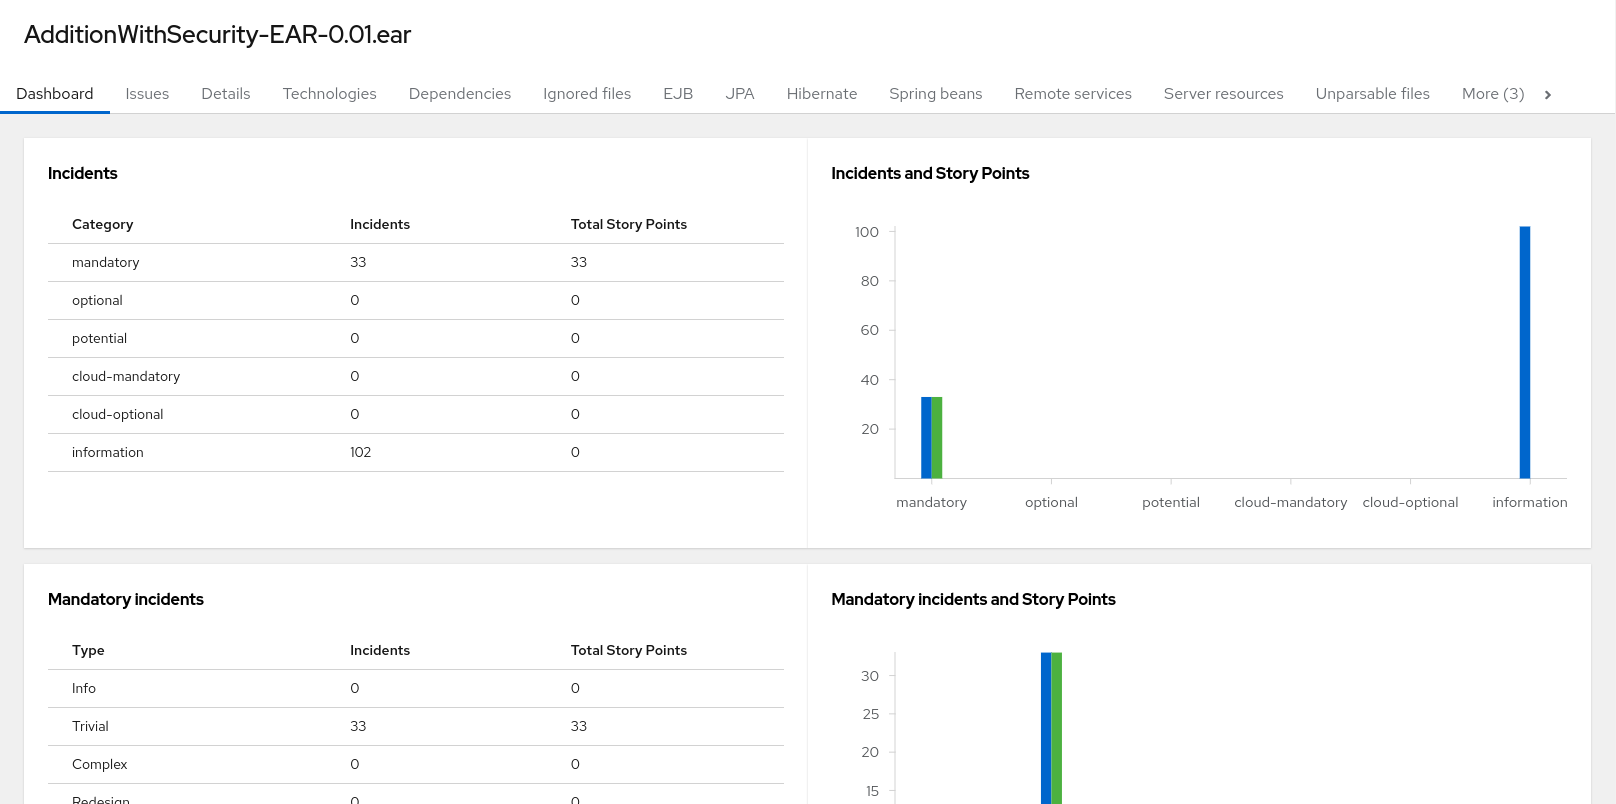
The top navigation bar lists the various reports that contain additional details about the migration of this application. Note that only those reports that are applicable to the current application will be available.
| Report | Description |
|---|---|
Issues |
Provides a concise summary of all issues that require attention. |
Application details |
Provides a detailed overview of all resources found within the application that may need attention during the migration. |
Technologies |
Displays all embedded libraries grouped by functionality, allowing you to quickly view the technologies used in each application. |
Dependencies |
Displays all Java-packaged dependencies found within the application. |
Unparsable |
Shows all files that MTA could not parse in the expected format. For instance, a file with a |
Remote services |
Displays all remote services references that were found within the application. |
EJBs |
Contains a list of EJBs found within the application. |
JBPM |
Contains all of the JBPM-related resources that were discovered during analysis. |
JPA |
Contains details on all JPA-related resources that were found in the application. |
Hibernate |
Contains details on all Hibernate-related resources that were found in the application. |
Server resources |
Displays all server resources (for example, JNDI resources) in the input application. |
Spring Beans |
Contains a list of Spring Beans found during the analysis. |
Hard-coded IP addresses |
Provides a list of all hard-coded IP addresses that were found in the application. |
Ignored files |
Lists the files found in the application that, based on certain rules and MTA configuration, were not processed. See the |
About |
Describes the current version of MTA and provides helpful links for further assistance. |
3.1.2. Issues report
Access this report from the dashboard by clicking the Issues link.
This report includes details about every issue that was raised by the selected migration paths. The following information is provided for each issue encountered:
-
A title to summarize the issue.
-
The total number of incidents, or times the issue was encountered.
-
The rule story points to resolve a single instance of the issue.
-
The estimated level of effort to resolve the issue.
-
The total story points to resolve every instance encountered. This is calculated by multiplying the number of incidents found by the story points per incident.

Each reported issue may be expanded, by clicking on the title, to obtain additional details. The following information is provided.
-
A list of files where the incidents occurred, along with the number of incidents within each file. If the file is a Java source file, then clicking the filename will direct you to the corresponding Source report.
-
A detailed description of the issue. This description outlines the problem, provides any known solutions, and references supporting documentation regarding either the issue or resolution.
-
A direct link, entitled Show Rule, to the rule that generated the issue.

Issues are sorted into four categories by default. Information on these categories is available at ask Category.
3.1.3. Application details report
Access this report from the dashboard by clicking the Application Details link.
The report lists the story points, the Java incidents by package, and a count of the occurrences of the technologies found in the application. Next is a display of application messages generated during the migration process. Finally, there is a breakdown of this information for each archive analyzed during the process.
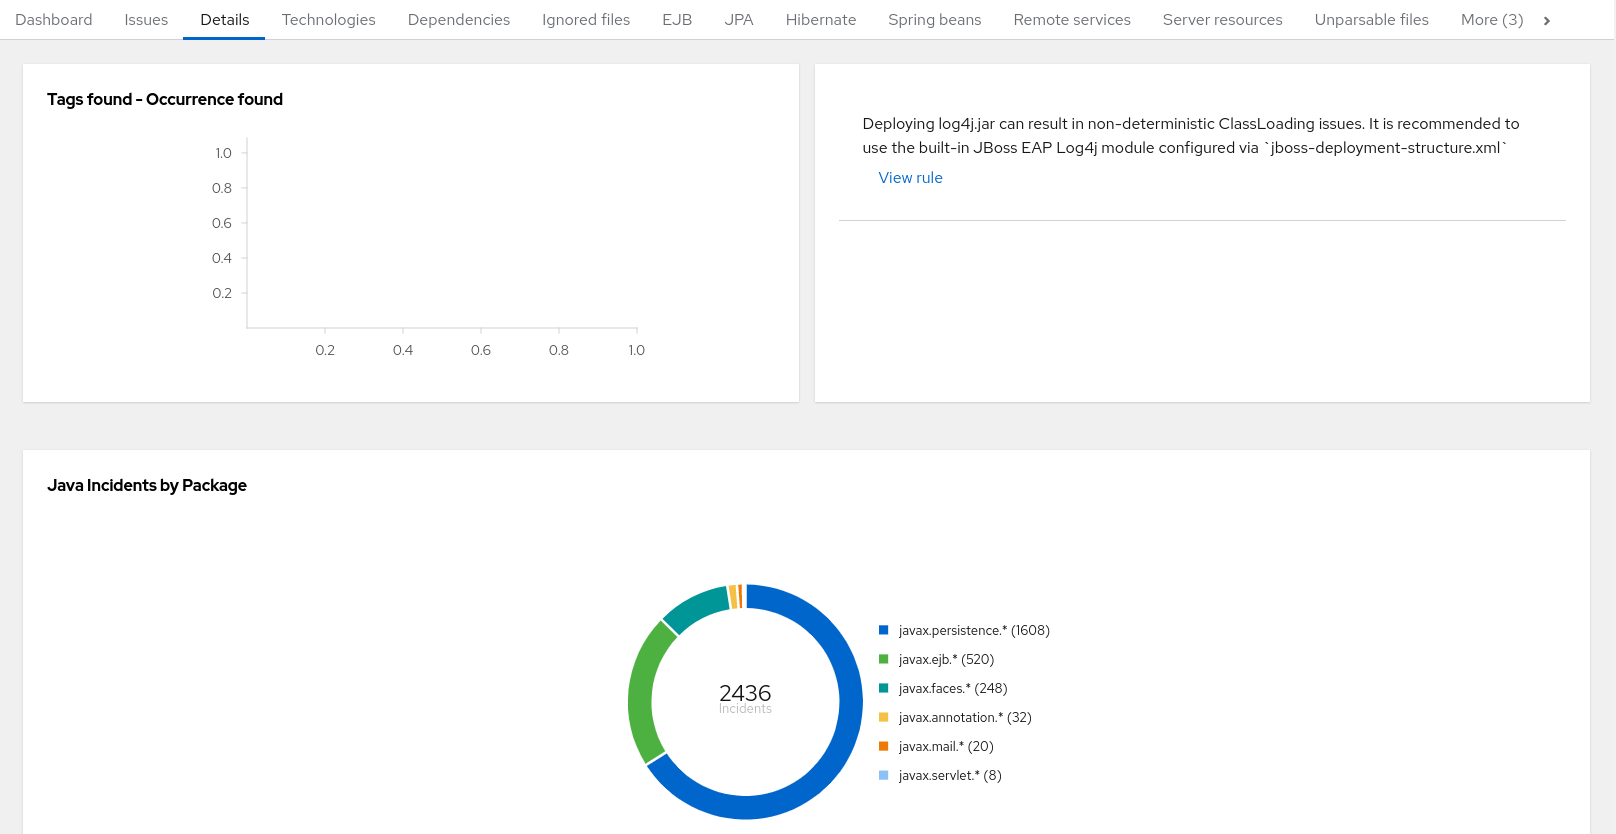
Expand the jee-example-app-1.0.0.ear/jee-example-services.jar to review the story points, Java incidents by package, and a count of the occurrences of the technologies found in this archive. This summary begins with a total of the story points assigned to its migration, followed by a table detailing the changes required for each file in the archive. The report contains the following columns.
| Column Name | Description |
|---|---|
Name |
The name of the file being analyzed. |
Technology |
The type of file being analyzed, for example, Decompiled Java File or Properties. |
Issues |
Warnings about areas of code that need review or changes. |
Story Points |
Level of effort required to migrate the file. |
Note that if an archive is duplicated several times in an application, it will be listed just once in the report and will be tagged with [Included multiple times].

The story points for archives that are duplicated within an application will be counted only once in the total story point count for that application.
3.1.4. Technologies report
Access this report from the dashboard by clicking the Technologies link.
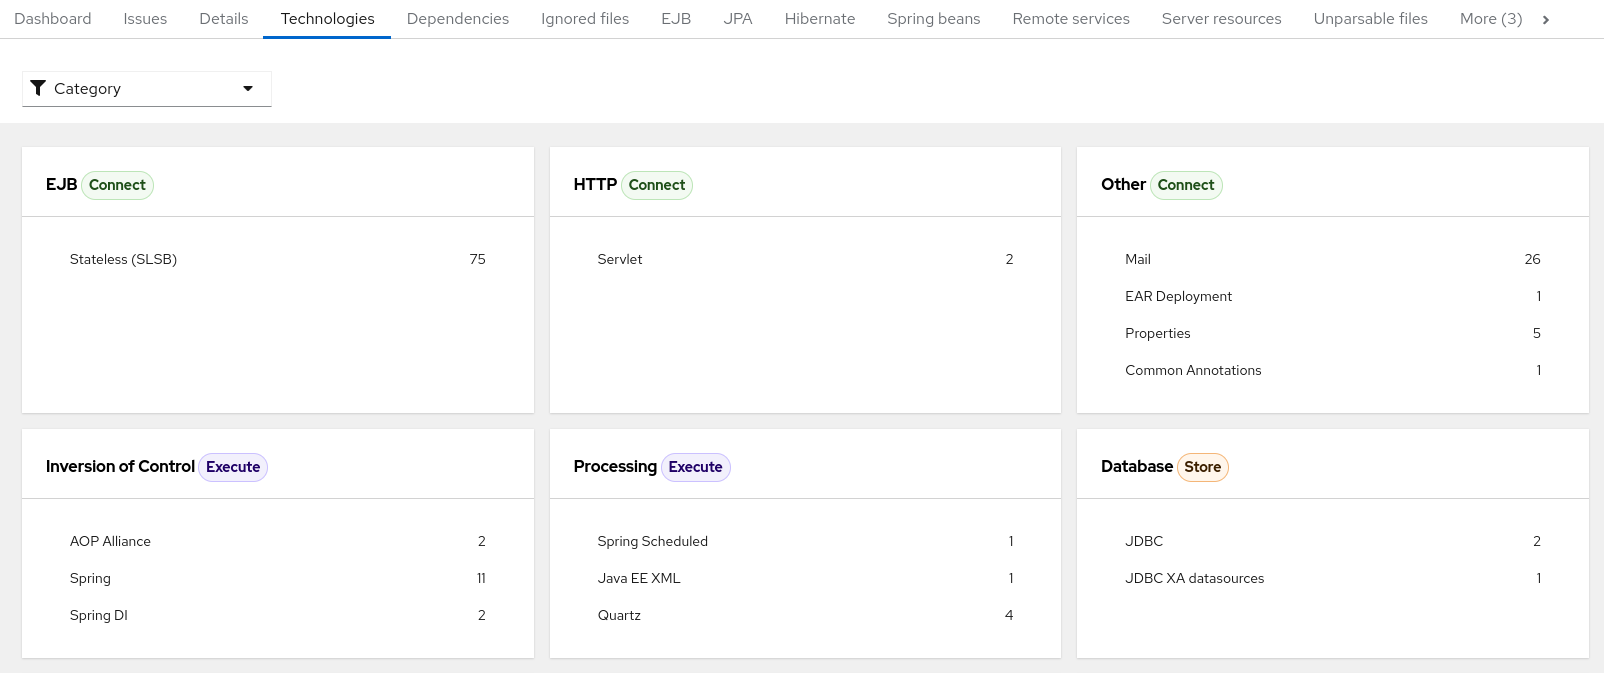
The report lists the occurrences of technologies, grouped by function, in the analyzed application. It is an overview of the technologies found in the application, and is designed to assist users in quickly understanding each application’s purpose.
The image below shows the technologies used in the jee-example-app.
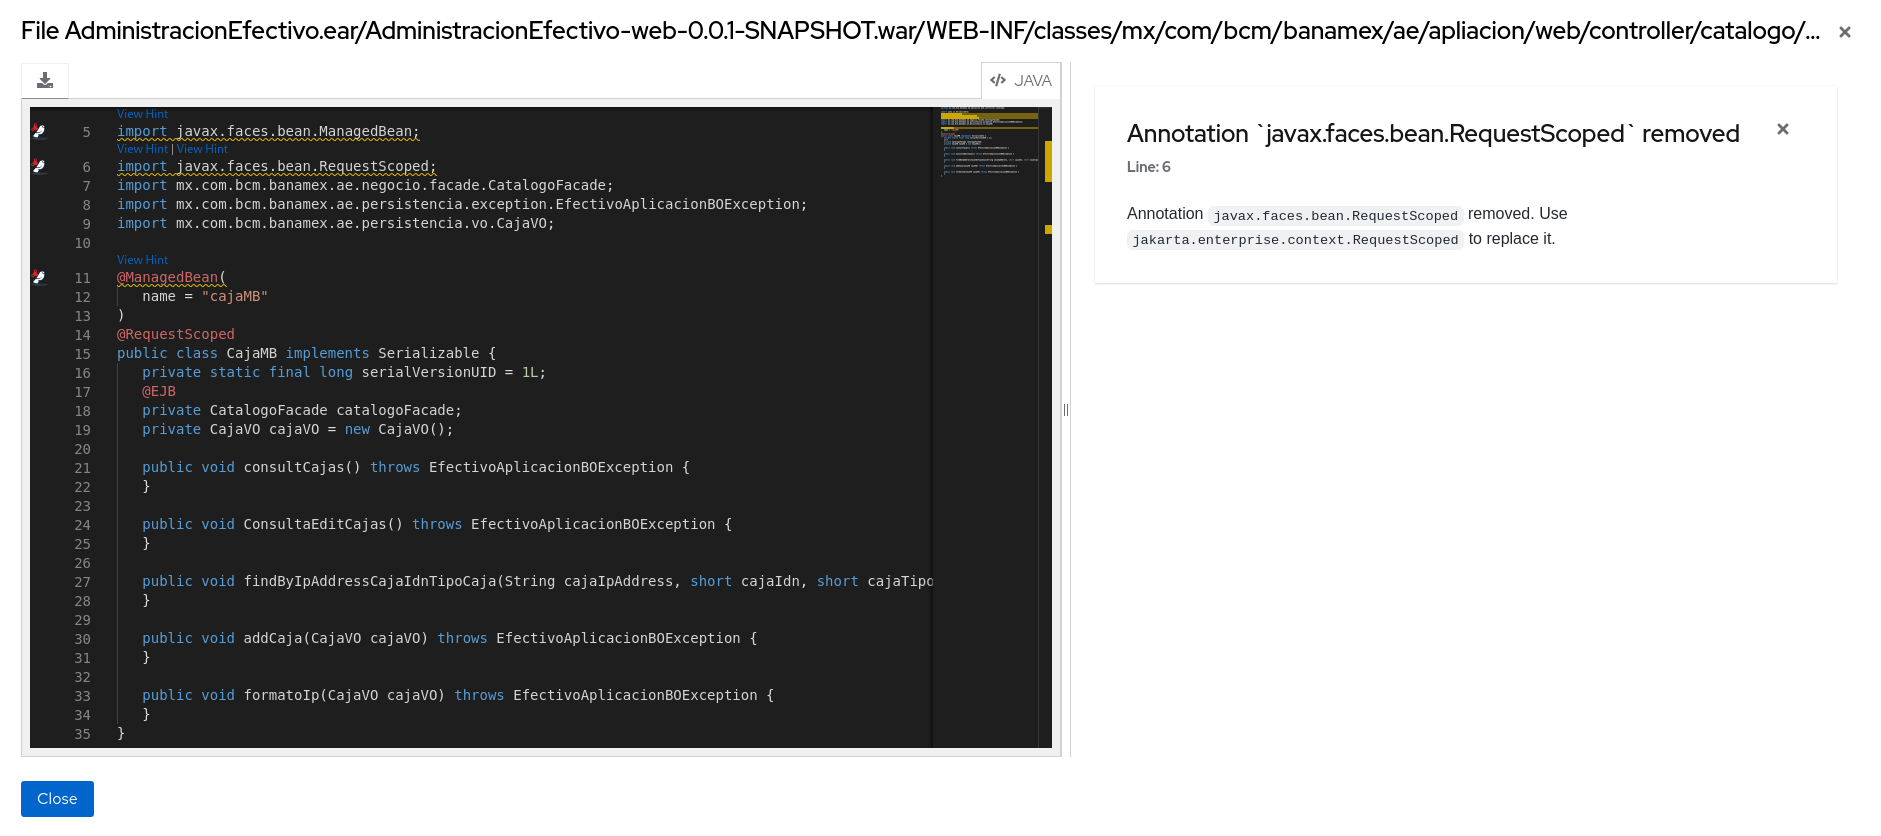
3.1.5. Source report
The Source report displays the migration issues in the context of the source file in which they were discovered.
3.2. Technologies report
Access this report from the report landing page by clicking the Technologies link.
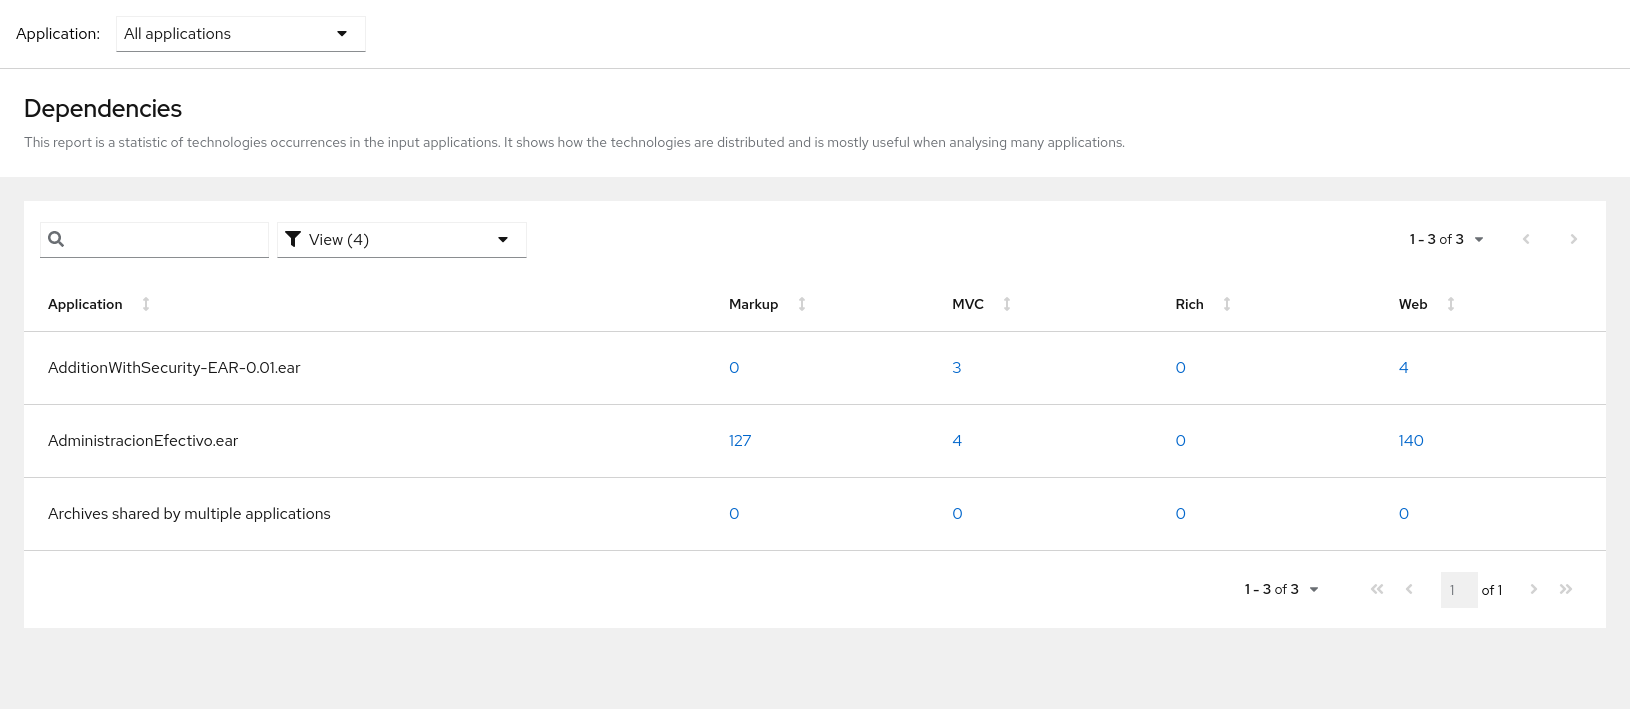
This report provides an aggregate listing of the technologies used, grouped by function, for the analyzed applications. It shows how the technologies are distributed, and is typically reviewed after analyzing a large number of applications to group the applications and identify patterns. It also shows the size, number of libraries, and story point totals of each application.
Clicking any of the headers, such as Markup, sorts the results in descending order. Selecting the same header again will resort the results in ascending order. The currently selected header is identified in bold, next to a directional arrow, indicating the direction of the sort.
3.3. Selecting packages
A space-delimited list of the packages to be evaluated by MTA. It is highly recommended to use this argument.
-
In most cases, you are interested only in evaluating custom application class packages and not standard Java EE or third party packages. The
<PACKAGE_N>argument is a package prefix; all subpackages will be scanned. For example, to scan the packagescom.mycustomappandcom.myotherapp, use--packages com.mycustomapp com.myotherappargument on the command line. -
While you can provide package names for standard Java EE third party software like
org.apache, it is usually best not to include them as they should not impact the migration effort.